
Based on a survey of 600 wineries and on how it understands the economy, Silicon Valley Bank is predicting that you will buy 11 to 15 percent more fine wine in 2011 than you did last year. “What do they know?” you ask, as you flash on your bank statement and your boss’s bad moods. Yet Silicon Valley Bank knows plenty. It is not just any bank. To open an account, you need to be recommended by another customer, preferably your lawyer. The institution developed in the 1980s and made loans to computer-related start-ups that no other bank would consider. In the 1990s, it provided the same service for California wineries when they desperately needed capital to replant thousands of acres that were infested by the phylloxera root louse. In its own words, “Silicon Valley Bank has the largest team of commercial bankers dedicated to the wine industry of any bank nationwide.”
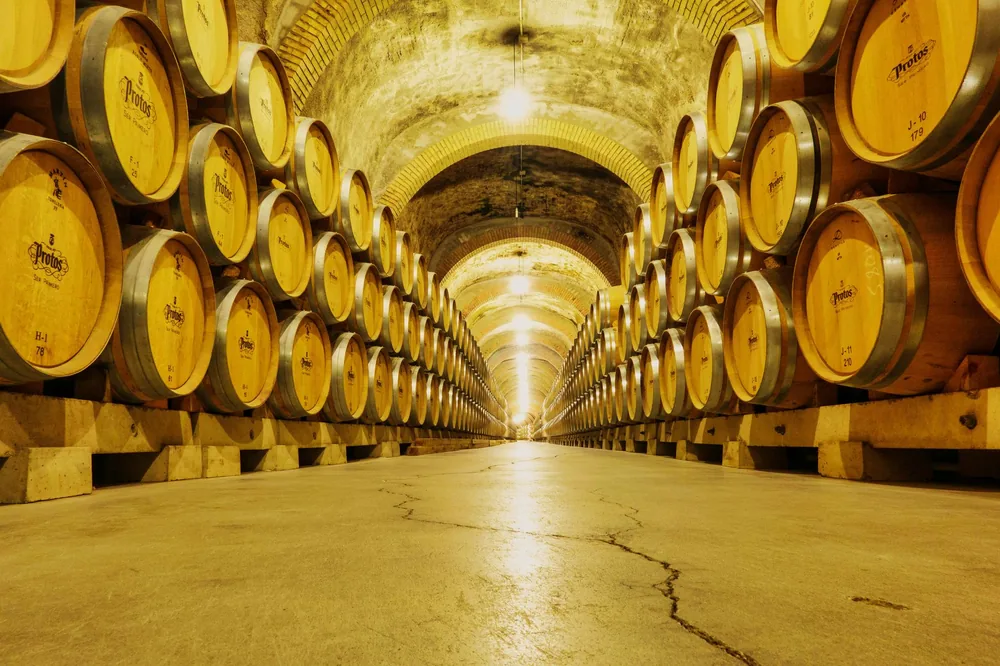
Its happy annual forecast has gushed like an over-flowing bottle of champagne all over the pages of wine trade journals. But since it’s basically predicting what, where, and how much wine you will be drinking this year, you have a right to know. Rob McMillan, founder of the bank’s Wine Division, is the author of the report and forecast, and the following is what he says about your wine drinking in 2011.
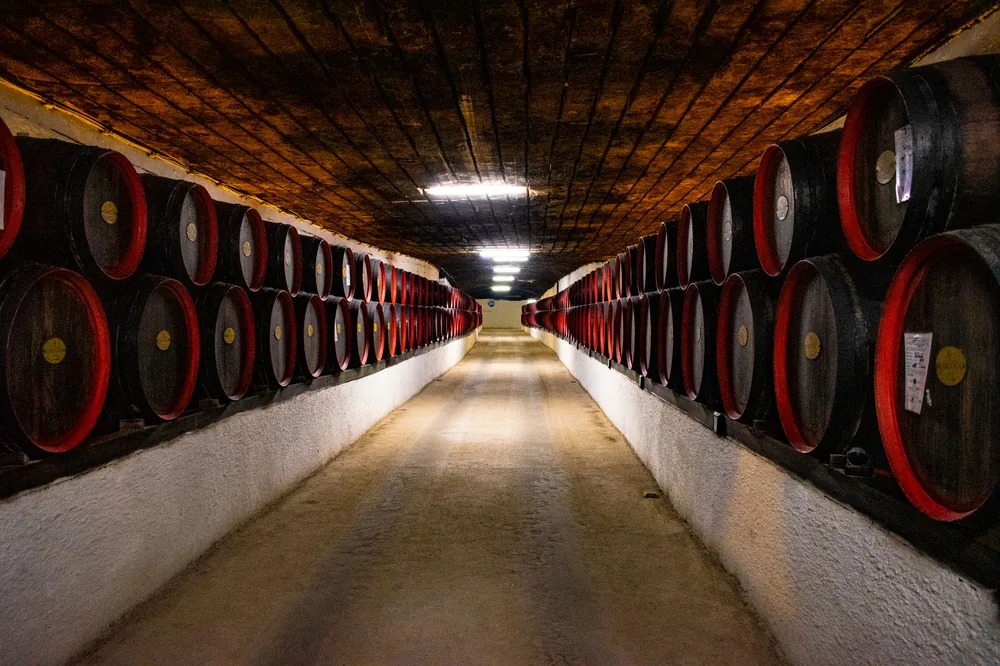
Growth in luxury goods will outpace the rest of the economy. Fine wine is defined in the report as starting at $15 and moving up from there. If you have investments in the stock market, you’ll be purchasing more wine at $41 an up, a category that had been moribund but that the report anticipates will show the most improvement. If most of your wealth is tied to your home, you’ll be spending less on luxury goods. But “2011 has started with real job growth accompanied by the first decline in the jobless rate in some time. Consumer confidence is improving and we expect to see the start of a healing middle class that will have a positive impact on fine wine sales.”
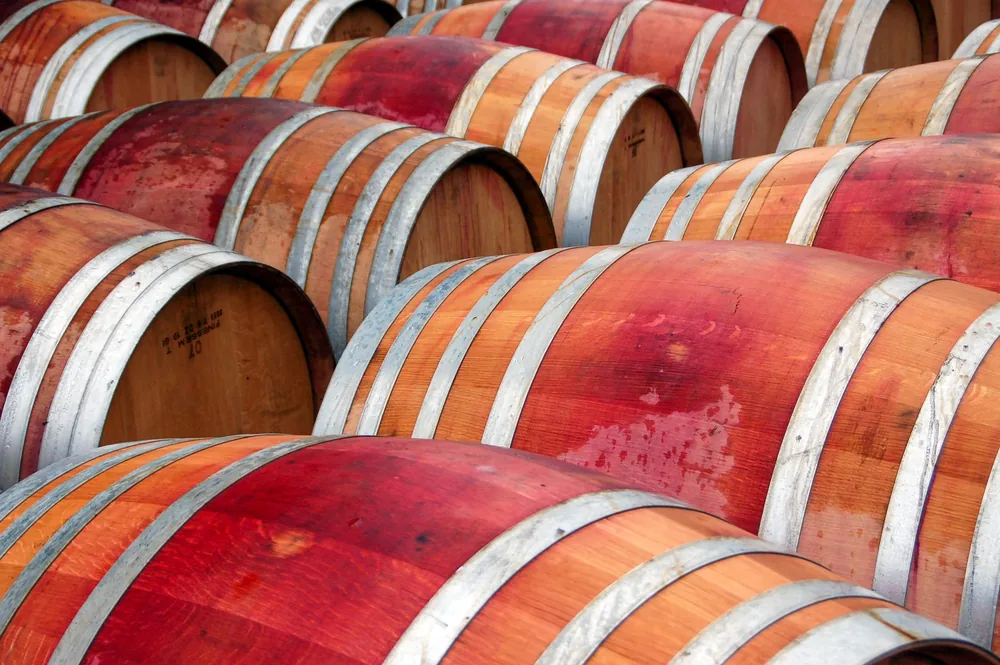
Marginally improved pricing power at the producer level. Prices may increase at that $41 level, but below that, they will remain mostly stable because the economy will continue to be soft. You’re not likely to be grabbing so many bottles between $15 and $41 that wineries will feel comfortable raising prices. On the other hand, we won’t see the kind of discounting that we’ve seen in the past two years.
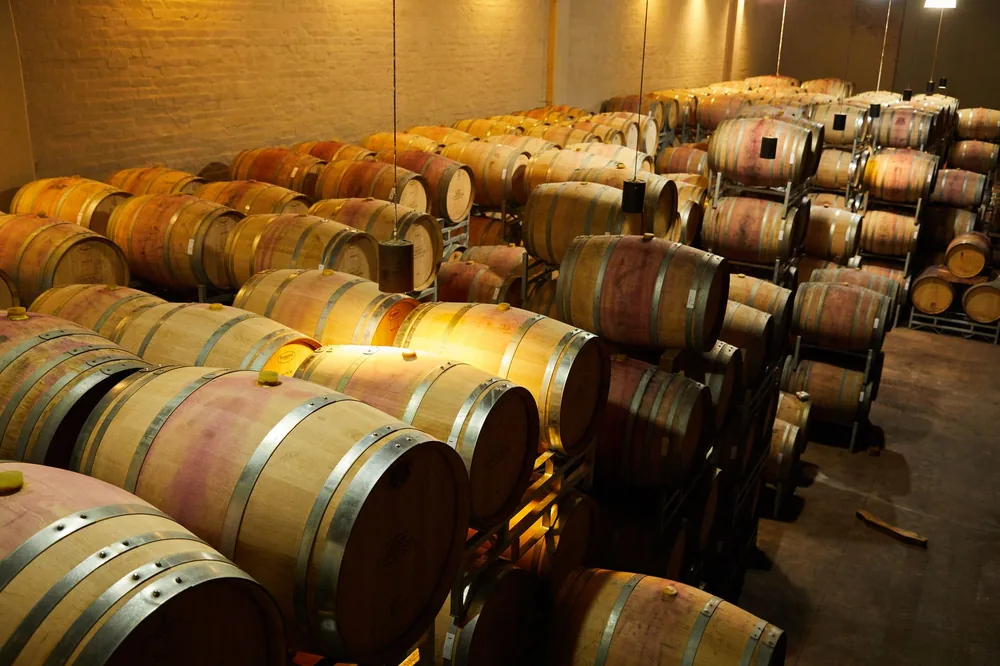
Boomers and Gen X, not Millennials, will support most of the fine wine recovery. If you are a Millennials, you are spending on average more per bottle than Gen Xers or Boomers, but you have the highest unemployment rate and the least wealth, so for now, you won’t be a fine wine player. Your older brothers and sisters and your parents, 55 years and older will be enjoying way more fine wine.
Improving restaurant sales, specifically in full-service restaurants. According to the National Restaurant Association, you are eating more often in “white tablecloth” restaurants, where most wineries normally sell between 20 and 30 percent of their wines. Such restaurants started a contraction phase as early as 2007, according to the report. “When negative press about the big bonuses for CEOs and Wall Street bankers collided with news of bailed out insurance giant AIG’s lavish spending on corporate retreats, corporate T&E and conspicuous consumption of all types was snuffed out.” So if you are a CEO, a Wall Street banker, or an AIG employee, you are now allowed to eat out. And so will the rest of us according to our means, whether we are affluent or middle class.
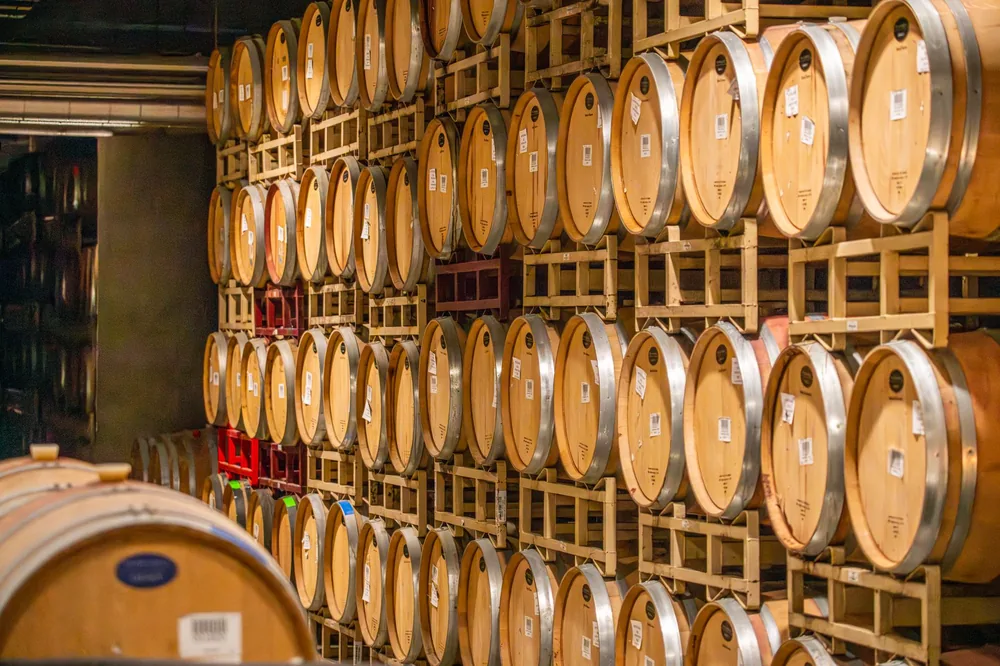
Producer level inventory closer to balance than most seem to think. Supply and demand determines the price of a bottle of wine, regardless of the cost of production. So after the banking crisis hit, you traded down to Two-Buck Chuck and glue, according to the report. Silicon Valley bankers are not without humor. Premium wine inventories backed up all along the chain from wineries to distributors to retailers. The back up is now being absorbed, and the current vintage is also smaller. If you continue to buy fine wine at your current rate, demand may soon equal supply, another reason why we will no longer see heavily discounted prices and instead may witness the beginning of slight increases, which ultimately are necessary. Wineries without profit die.
How a Wine Forecast Is Built
A projection like the one described above blends two very different inputs: what producers say they expect, and what broad economic indicators suggest. The survey half captures sentiment, which can run well ahead of or behind actual behavior. The economic half rests on employment, consumer confidence, and household wealth, and those three rarely move in step with one another.
That mismatch is why such forecasts are stated as a range rather than a single figure. A range concedes that the same inputs can produce several plausible outcomes. The useful way to read one is as a hypothesis about the year ahead, not a record of it.
Where the Underlying Numbers Come From
Commentary about the wine market draws on several separate data streams, and each counts something different. Treating them as interchangeable is the quickest route to a distorted picture of any given year.
| Data stream | What it counts | Reporting rhythm |
|---|---|---|
| Producer surveys | Expectations and sentiment of winery owners | Usually annual |
| Federal permit and excise records | Bonded wineries and taxable removals | Continuous |
| Trade association shipment estimates | Cases entering the market | Annual |
| Crop and acreage reports | Tons harvested and vines in the ground | Seasonal |
None of these series records what a household actually opened in a given week. They record grapes harvested, cases shipped, and taxes paid, which is why analysts triangulate instead of leaning on one number. The Wine Institute maintains long-running statistics on California wine shipments and consumption that show how slowly these aggregate lines tend to move.
What a Price Tier Actually Describes
Segments such as “under fifteen dollars” or “forty-one and above” are accounting conveniences, not verdicts on quality. Each tier carries a distinct cost structure built from fruit contracts, barrel programs, packaging, and the route the wine takes to the table. A bottle crosses between tiers when those costs shift, which is not the same as the wine itself changing.
The same logic explains why discounting behaves differently at each level. Inexpensive wine competes on volume and can absorb a markdown, while the scarcest bottles compete on reputation and seldom move on price at all. Anyone curious about how vineyard location feeds that cost structure will find it laid out in our survey of California growing regions, where yields and land values differ enormously between valley floor and mountain bench.
FAQ: Reading Wine Market Predictions
Does a forecast of higher spending mean prices went up?
Not by itself. Total spending can rise because drinkers chose more expensive bottles, because they opened more of them, or both at once. Only a separate reading of volume alongside average price can separate those explanations.
Why are generations discussed as separate blocks?
Age cohorts differ in income, debt load, and household size, and those factors drive discretionary spending more reliably than taste does. Splitting them matters because a gain in one cohort can cancel a loss in another and leave the overall total looking motionless.
Is an old forecast still worth revisiting?
Yes, as a calibration exercise. Setting what an analyst expected against what later data showed is the fastest way to learn which parts of a forecast tend to hold. Our archive of wine industry commentary keeps those older predictions beside the years that followed, and the wine skills and knowledge collection covers the vocabulary they use.